OFFICIAL BENCHMARK LOGS
H200-SXM5-RUN-2024.11
Benchmark Scorecard & Research Metrics
Empirical verification across 1,575,540 temporal frames and 43,843 audio sequences on NVIDIA H200 GPU cluster.
NVIDIA H200 SXM5 141GB
20.05ms Temporal Hop
PyTorch 2.14 / CUDA 12.2
TABLE 1
1,531,761 Evaluated Frames
Primary Benchmark — MLAAD + M-AILABS Held-Out Test Set
Header Caption: Primary Evaluation: 3,839 Unseen 8.0s Sequences (1,531,761 Discrete Temporal Frames @ 20.05ms resolution across 39 Generative Engines)
| Acoustic Class | Precision | Recall | F1-Score | Support (Frames) |
|---|---|---|---|---|
| Human Speech Frame | 99.57% | 96.69% | 0.9811 | 772,672 |
| AI Synthetic Frame | 96.73% | 99.58% | 0.9813 | 759,089 |
| Overall Metric (Macro) | 98.15% | 98.13% | 0.9812 | 1,531,761 Frames |
Decision Level: Majority Vote
98.25%
Macro F1: 0.9825 · 3,839 test pairs
Confusion Matrix — 1.53M Frames
TN (Human Correct)747,085
FP (False Alarm)25,587
FN (AI Missed)3,220
TP (AI Caught)755,869
Critical Error ProfileForensic Bounds
Missed Detection Rate (FN/AI)0.42%
False Alarm Rate (FP/Human)3.31%
TABLE 2
CodecFake Zero-Shot Generalization Benchmark (12,000 Balanced Files)
A1: Zero-Shot ALM
C7: Unseen DAC
Header Caption: Cross-Dataset Evaluation across Audio Language Models (ALM) and Discrete RVQ Neural Audio Codecs
| Cond. | Architecture | Evaluated | EER (%) | AUC-ROC (%) | Calibrated Acc (%) | Calibrated F1 | Opt Threshold (τ) | Uncalibrated Acc (0.5) |
|---|---|---|---|---|---|---|---|---|
| A1 | Audio Language Model (VALL-E) Zero-Shot | 2,000 | 0.70% | 99.97% | 99.30% | 0.9930 | 0.4942 | 99.20% |
| C2 | SoundStream / SpeechTokenizer | 2,000 | 2.15% | 99.82% | 97.85% | 0.9785 | 0.0525 | 94.60% |
| C3 | FunCodec | 2,000 | 2.55% | 99.43% | 97.45% | 0.9745 | 0.0432 | 94.95% |
| C5 | AudioDec | 2,000 | 0.30% | 100.00% | 99.70% | 0.9970 | 0.3036 | 99.65% |
| C6 | AcademicCodec | 2,000 | 18.10% | 90.06% | 81.90% | 0.8190 | 0.0069 | 61.95% |
| C7 | Unseen Neural Codec (DAC) Held-Out Zero-Shot | 2,000 | 25.25% | 84.20% | 74.75% | 0.7475 | 0.0054 | 56.75% |
| OVERALL | Full Benchmark Summary | 12,000 | 11.32% | 94.93% | 88.68% | 0.8868 | 0.0127 | 84.52% |
TABLE 3
In-The-Wild (ITW) Benchmark Comparison (31,779 YouTube/TikTok Tracks)
State-of-the-Art:
ITW EER 18.90% → 8.02%
Header Caption: Real-World Litmus Test: Unconstrained Social Media Audio across 58 Celebrities/Politicians
| Model Architecture | Training Domain / Paradigm | AUC-ROC (%) | EER (%) | Accuracy (%) | Macro F1 | Reference |
|---|---|---|---|---|---|---|
| RawNet2 | ASVspoof 2019 (Vocoder baseline) | 73.00% | 33.80% | — | — | Müller et al. (2022) |
| RawGAT-ST | ASVspoof 2019 (Graph baseline) | 71.00% | 33.70% | — | — | Tak et al. (2021) |
| AASIST | ASVspoof 2019 (Spectro-Temporal GAT) | 81.00% | 18.90% | — | — | Jung et al. (2022) |
| DeepEcho v22 (Base) | MLAAD Only (Studio vocoders) | 67.04% | 36.15% | 63.46% | 0.6264 | Our Baseline |
| DeepEcho-SAM (Adapted) | Seen Codecs + Vocoders | 91.60% | 14.35% | 85.65% | 0.8493 | Intermediate Checkpoint |
| ★DeepEcho-SAM (Final) | Causal Channel Invariance | 95.76% | 8.02% | 91.98% | 0.9151 | Our Final Champion (v2) SOTA |
SECTION 4
2 Figures Rendered
Forensic Research Visualizations
Acoustic boundary analysis and multi-layer feature representation dynamics.
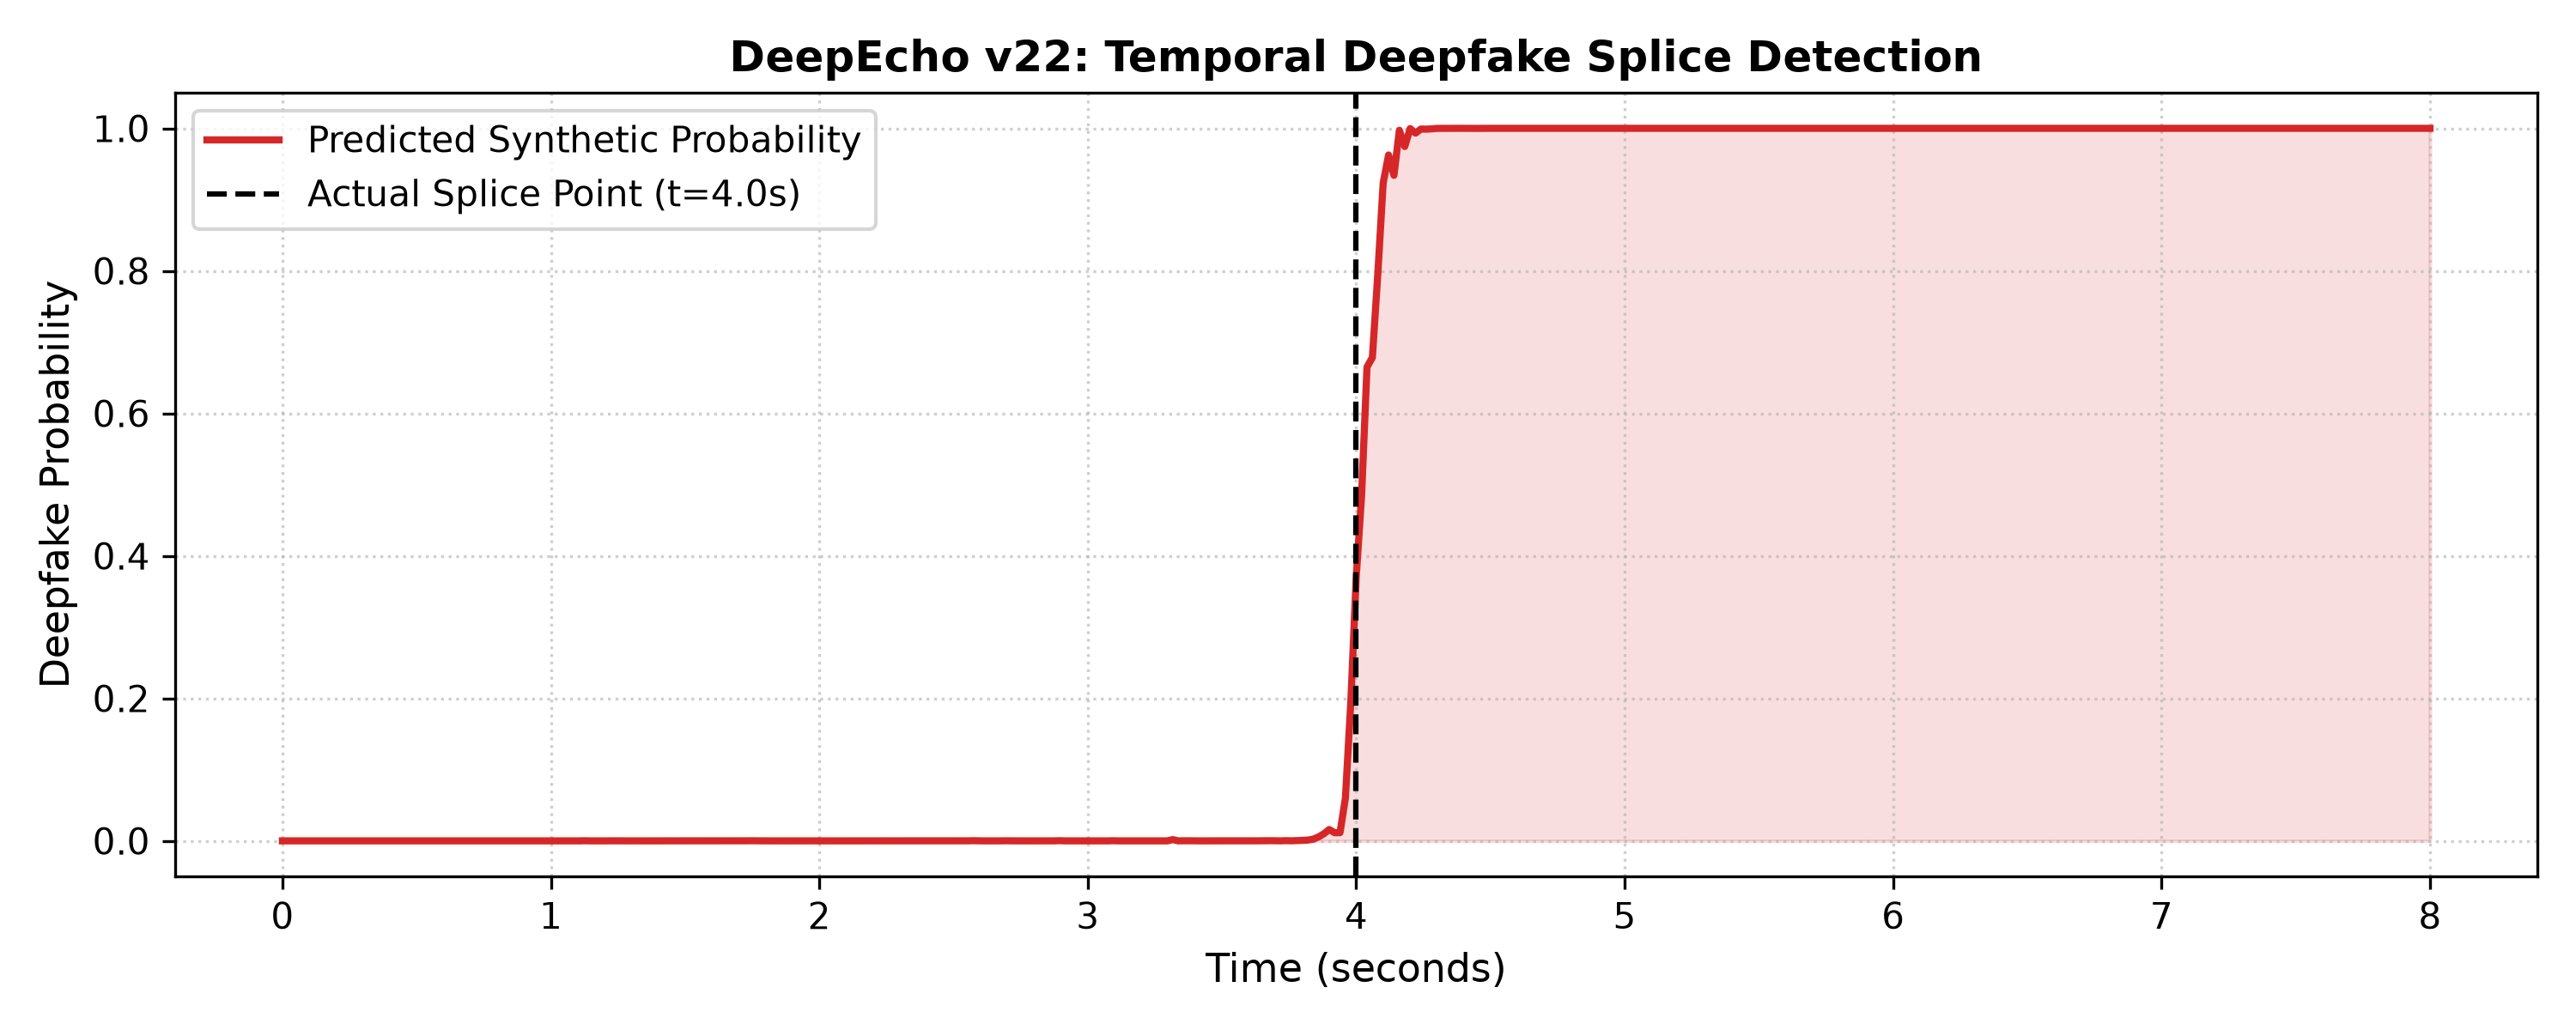
Figure 1: 20ms Temporal Splice Localization — Constant-power trigonometric OLA splicing at t = 4.0s.
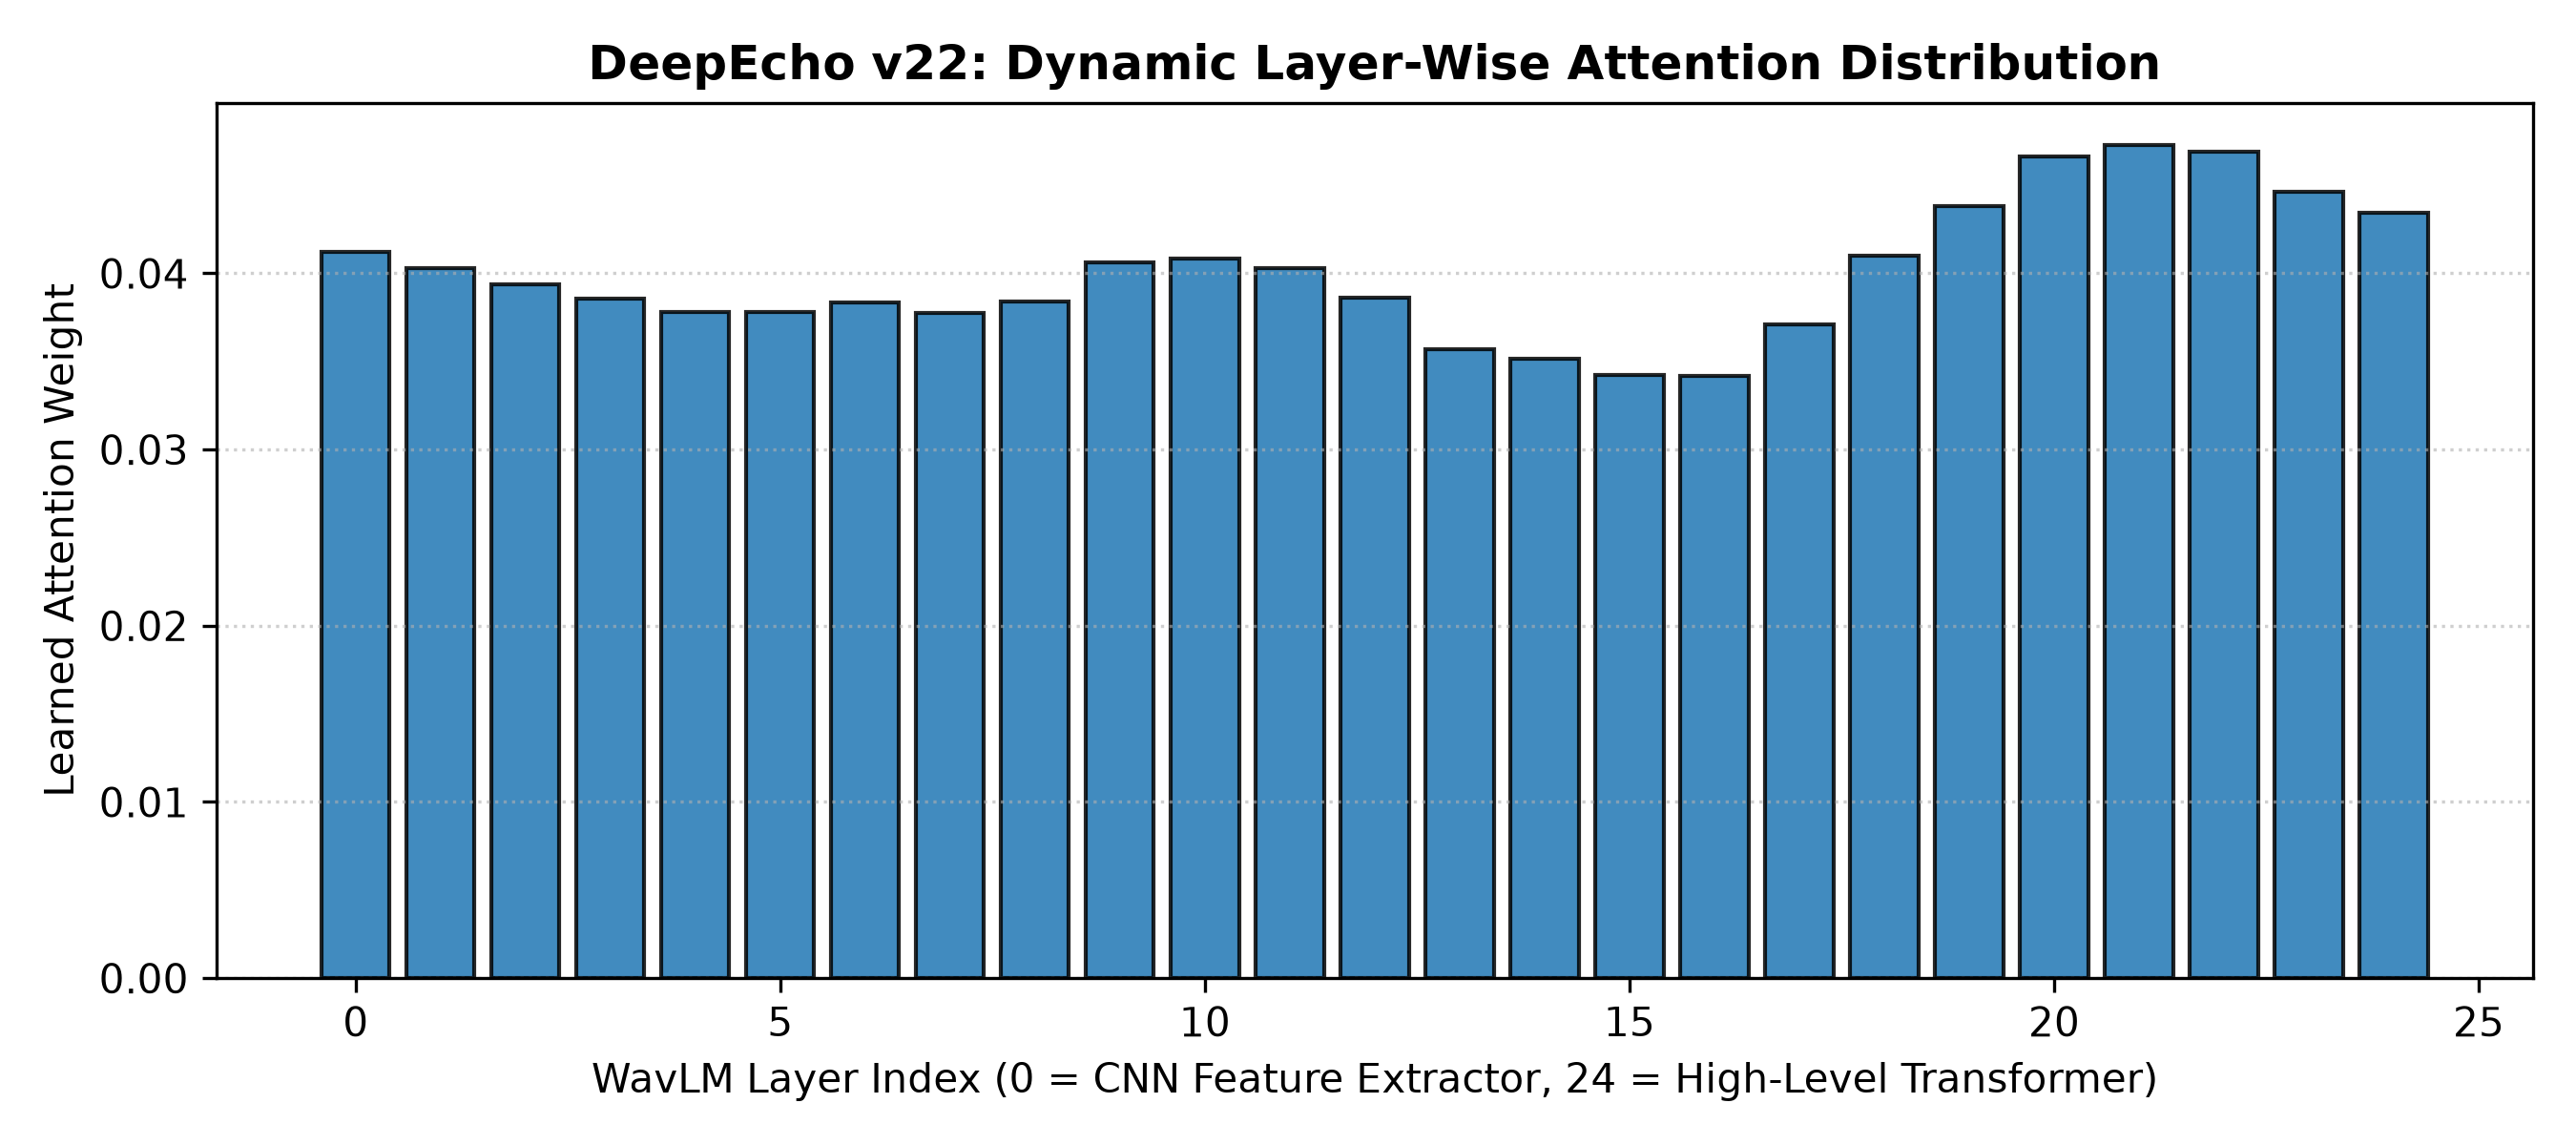
Figure 2: Dynamic 25-Layer Softmax Attention Weights — Acoustic textures (lower layers) vs. Semantic prosody (upper layers).
Live Multi-Domain Random Audit
Randomly select a balanced batch across domains and run live inference on local physical files.
| Domain / Benchmark | Audio File | Ground Truth | Model Prediction | Fake Probability (%) | Verdict Status |
|---|---|---|---|---|---|
| Click Run Live Random Audit to begin batch evaluation. | |||||